How To
RadiaLE allows researchers to design new LQEs and validate them. The following steps illustrate how to use RadiaLE to achieve this goal:
- Preparing the network infrastructure. Users have to prepare their own wireless sensor network infrastructure, according to the RadiaLE hardware architecture, illustrated in the above picture, but with no restriction on the number of nodes (it can be less or greater than 49 nodes). An example for the establishment of such infrastructure is given in [ Experiments at Porto ].
- Install RadiaLE software tool. RadiaLE software tool is open-source, available for download, and platform-independent. All necessary steps to install this tool are provided in [ Install RadiaLE software tool ].
- Implement and integrate the new LQE to DataAnlApp. The different steps are given in [ Integrate new LQE to RadiaLE ].
- Setting-up and performing experiment. Users have to specify network parameters using the ExpCtrApp, and then run the experiment. During the experiment, link measurements gathered though packet-statistics collection are stored in the MySQL database. A tutorial that explores ExpCtrApp facilities is given in [ Using ExpCtrApp application ].
- Data analysis. After the experiment finishes, users have to use the DataAnlApp in order to process the collected data, namely generate LQEs, tune them, visualyze their statistical properties, and generate several plots for the channel behaviour analysis. A tutorial that explores DataAnlApp facilities is given in [ Using DataAnlApp application ].
- The performance evaluation of the new LQE is performed using DataAnlApp by analyzing its reliablity and stability. The reliability can be evaluated by analyzing (i.) the distribution of link quality estimates, illustrated by the empirical CDF plot, and a scatter plot; and (ii.) the LQE temporal behavior. The stability is evaluated by the measure of the coefficient of variation of link quality estimates. Users are invited to read our paper [F-LQE: a Fuzzy Link Quality Estimator] to get an idea on how to interpret the generated plots to analyze the reliability and the stability of LQEs.
Experiment at Porto
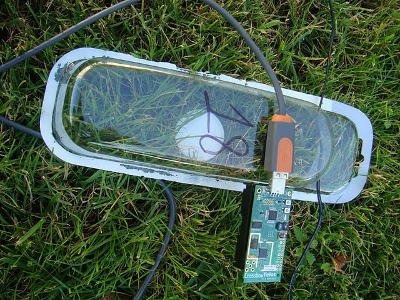
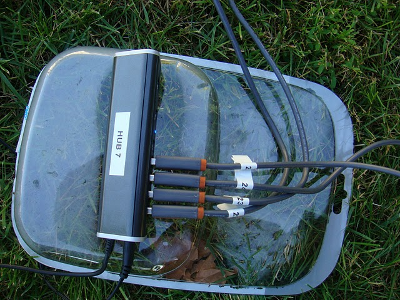
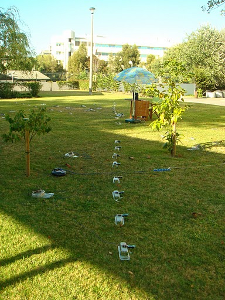
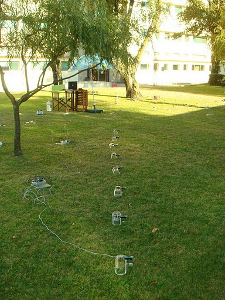
We have deployed 49 TelosB motes, at an outdoor environment: A garden in the Polytechnic Institute of Porto.
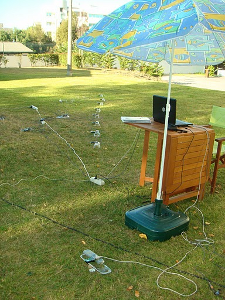
Motes are placed according to the Radial topology, and connected to a control PC via a USB tree:
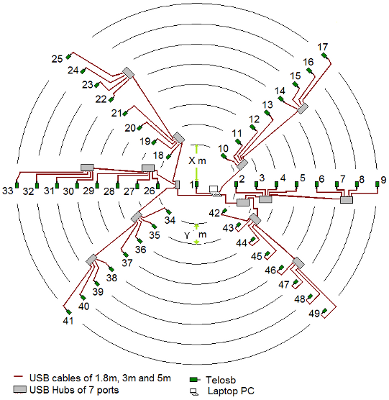 |
Nodes distribution according the Radial topology |
| Download our experimental Database here |
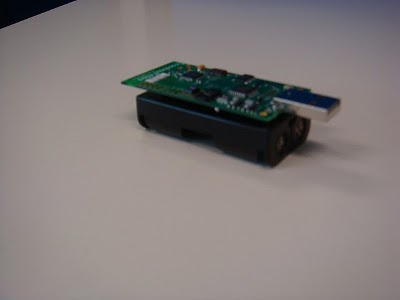
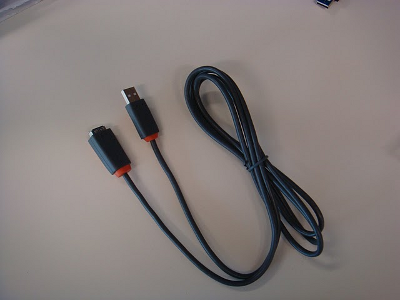
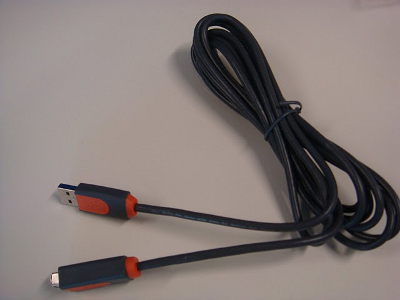
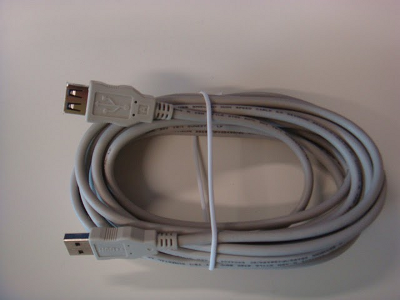
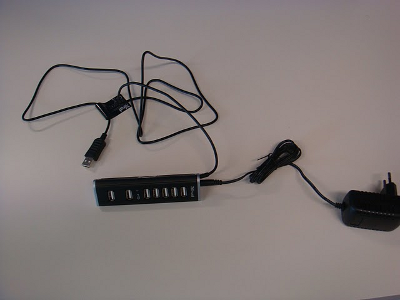
| - The following gallery depicts the hardware components |
       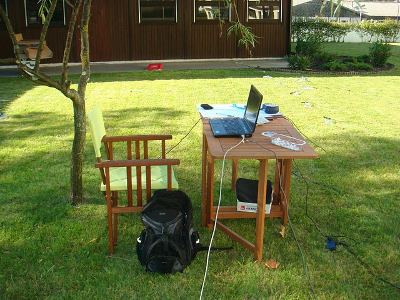
|
| - The following gallery depicts the Radial topology deployment: |
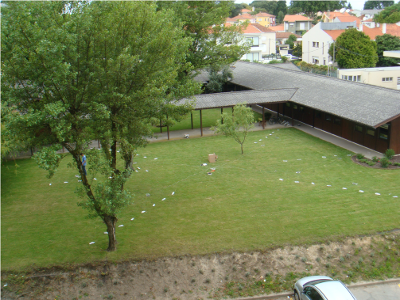 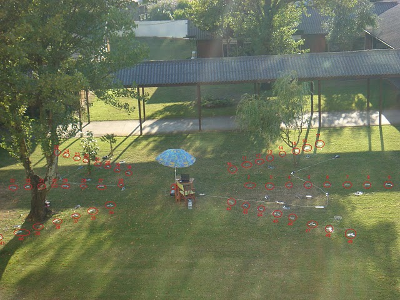 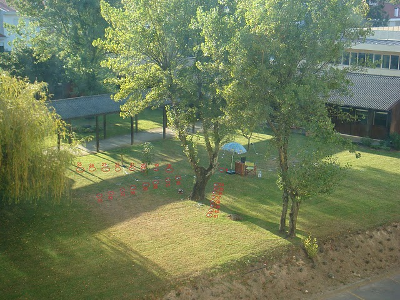   
|